Corelogic National Housing Market Update | March 2021

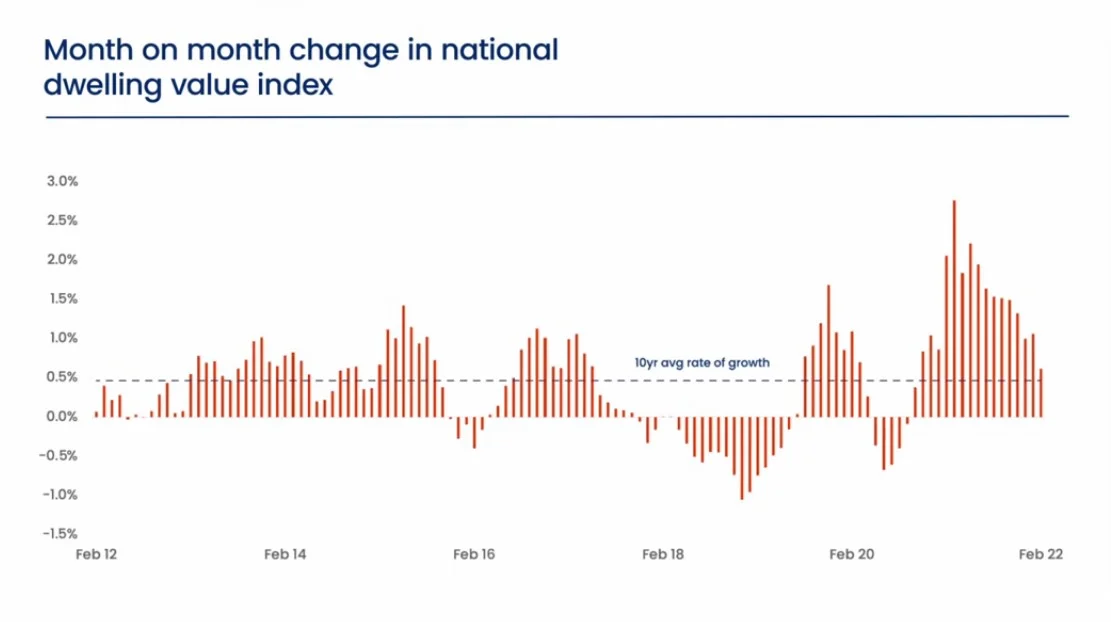
CoreLogic’s national Home Value Index posted a 0.6% gain last month, taking Australia’s housing market into the 17th consecutive month of increasing values.
While housing prices are still generally rising, the pace of growth in the national index has been easing since April last year.February’s growth of 0.6% marks the lowest monthly growth reading since October 2020 and is now down from 1.1% in January and down from the cyclical peak of 2.8% in March 2021. Every capital city and broad ‘rest of state’ region is now recording a slowing trend in value growth, albeit with significant diversity.
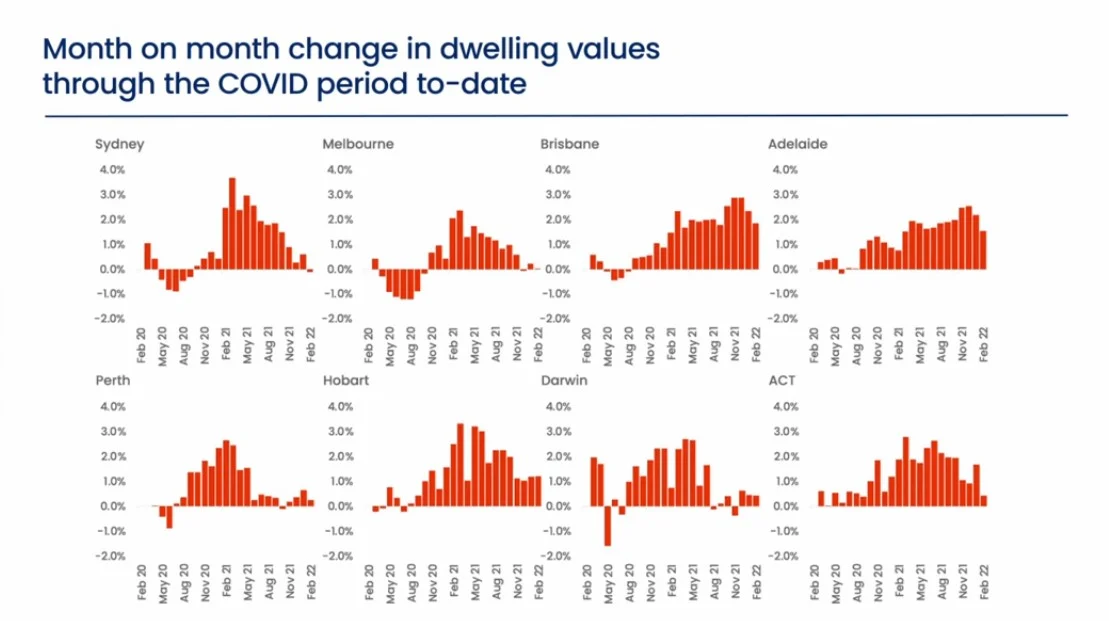
Sydney and Melbourne have shown the sharpest slowdown, with Sydney posting the first decline in housing values since September 2020, while Melbourne housing values were unchanged over the month, following a similar and relatively flat outcome in December and in January.
Conditions are easing less noticeably across the smaller capitals, especially in Brisbane, Adelaide, and Hobart, where housing values rose by more than 1% in February.
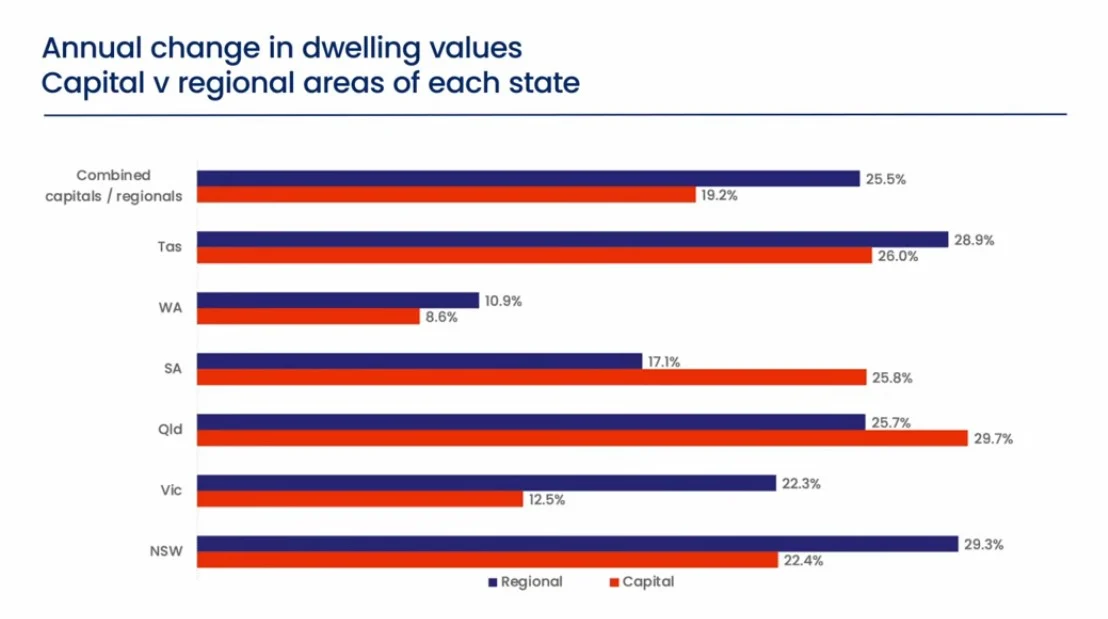
Similarly, regional markets have been somewhat insulated to slowing growth conditions, with five of the six rest-of-state regions continuing to record monthly gains if excess of 1.2%.
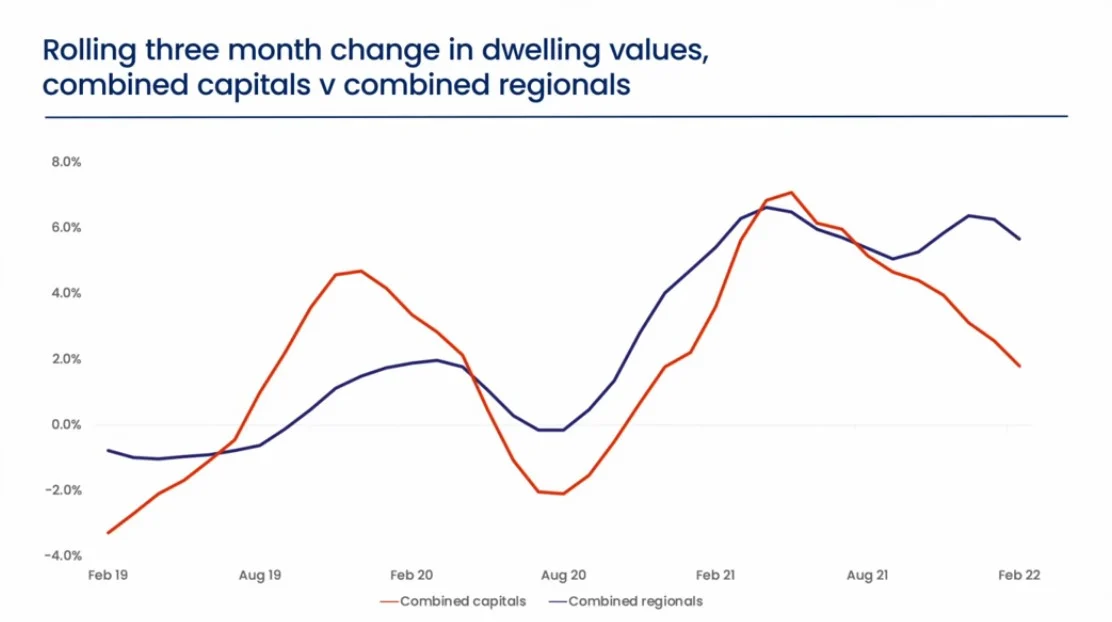
Over the past three months, housing values across the combined rest-of-state regions increased at more than three times the speed of housing values across the combined capital cities; at 5.7% and 1.8% respectively.
Regional housing markets aren’t likely to be immune from the higher cost of debt as fixed-term mortgage rates rise.
These markets are also increasingly impacted by worsening affordability constraints as housing prices consistently and substantially outpace incomes.
However, demographic tailwinds, low inventory levels, and ongoing demand for coastal of treechange housing options are keeping upwards pressure on housing prices.
Advertised inventory levels help to explain some of the divergences in housing growth trends.
In Melbourne advertised stock levels are now above average, tracking 5.5% higher than a year ago and 4.7% above the previous five-year average.
The trend is similar but not quite as advanced in Sydney, with total advertised stock levels 6.3% higher than last year but still 4.7% below the previous five-year average.
More choice translates to less urgency for buyers and some empowerment at the negotiation table.
The cities where housing values are rising more rapidly continue to show a clear lack of available properties to purchase.
Total listings across Brisbane and Adelaide remain more than 20% lower than a year ago and more than 40% below the previous five-year average.
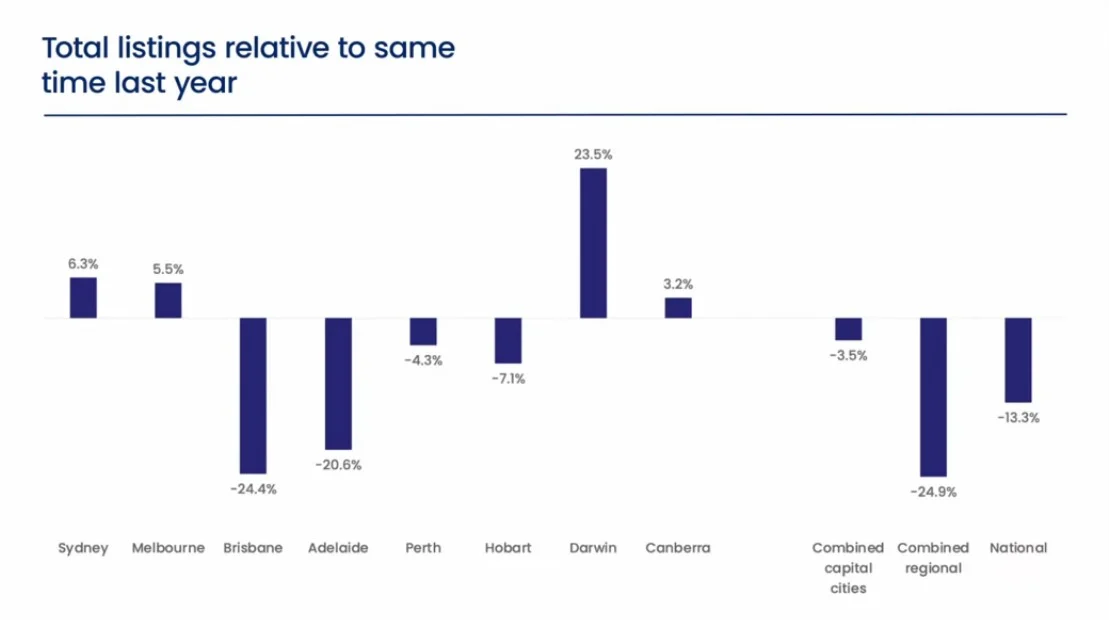
Similarly, advertised supply across the combined test-of-state markets was nearly 25% below last year and almost 45% below the five-year average.
As housing conditions evolve we are seeing more diversity across each of the capital cities.